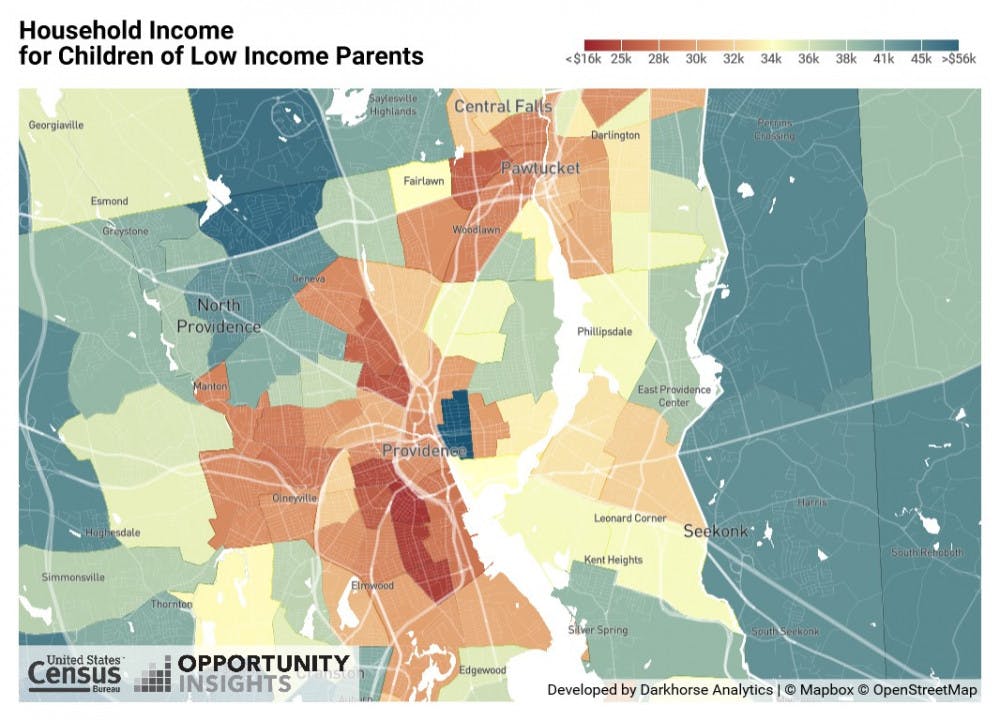
Whether by confirming visible disparities or exposing new ones, a new data-based map titled “Opportunity Atlas” uses decades of income data on residents to illustrate the difference a neighborhood can make on a child’s future income — in Providence and throughout the nation.
Researchers investigated how a low-income child’s neighborhood — isolated from parental income, education or other factors — can predict their average annual household earning as an adult, The Herald previously reported.
Over the course of 18 months, Associate Professor of Economics John Friedman co-led a team of researchers from the University, Harvard and the U.S. Census Bureau that broke down income predictions on the level of a tract, a geographic area that contains an average of 4,000 people as defined by the U.S. Census Bureau.
According to Opportunity Atlas’ dataset, Providence exemplifies national trends in urban inequality.
Professor of Sociology John Logan said the study “reinforces patterns that we were familiar with” but adds a new perspective by focusing on the mobility of children over time — and doing so with an extensive dataset from the Internal Revenue Service.
Inequality in Providence has a long history: Its manufacturing industry began to deteriorate in the 1950s, which burdened the city’s economy, Logan said. The city then “became a magnet for immigration because of the high vacancies and the low rent,” he added. Over time, these economic and demographic changes have compounded so that Providence’s poverty center has “deepened.”
Altogether, “Providence, despite this progressive political base, is among the most unequal cities in the country,” Logan said. While many other cities have also seen declines in manufacturing industries and increases in immigration over the last decades, Providence is one of the few to have simultaneously experienced growth concentrated in prosperous areas — such as College Hill and the East Side, he added.
The data show that very few children from low-income families live on College Hill at all — just 12 out of 207 children are from low-income families in the tract west of Thayer Street, and about 21 out of 152 reside in the tract to the east. These numbers are too low for conclusive income predictions to be made for low-income children inhabiting these tracts.
For children from middle-income families on College Hill, where they grew up with respect to Thayer Street makes a difference to their economic prospects. While students from middle-income families west of Thayer Street are predicted to make $68,000 in annual household income, the prediction stands at just $42,000 immediately to the east.
Data on income predictions from families at all socioeconomic levels capture the division between the peak affluence on College Hill and the bleaker prospects of the rest of the city. In the tract that includes many of the University’s and Rhode Island School of Design’s academic buildings, children are predicted to make $72,000 in annual household income. In the neighboring tract, on the other side of North Main Street that includes Providence Place Mall, the Rhode Island State House and Kennedy Plaza, chances are that children will grow up to make $41,000 (though this estimate is based on only 60 children).
The dataset “doesn’t allow us to identify the causal effects of university mobility,” said Harvard predoctoral fellow and Opportunity Atlas researcher Jack Hoyle. He added that this could be an area for future research.
The University “can be perceived as a progressive force, helping to revitalize the city, or it can be seen as participating in a kind of growth whose benefits will be reaped by some kinds of people and not others,” Logan said.
Providence’s downtown neighborhoods offer children the worst chances for future incomes in the city, especially further south, according to Opportunity Atlas. The lowest estimate corresponds to a tract in downtown Providence, just south of Federal Hill, where 758 children from low-income families, defined as at or below the 25th percentile for income, are predicted to have $23,000 annual household salaries as adults. In an adjacent tract, just single street south, that prediction rises to $29,000, based on data from about 2,100 children. Many adjacent tracts have disparities of about $2,000, which is approximately the margin of error of Opportunity Atlas general income estimates. Predictions tend to stay below $30,000 throughout downtown Providence tracts.
The most drastic disparities can be found northwest of the city, where hard lines between tracts trace divisions as great as $10,000 between some affluent suburbs and the rest of the city.
Divisions between tracts and minimum predicted income become more stark when accounting for differences in ethnic groups, both locally and nationally. In Providence city center, black low-income residents of Smith Hill are projected to make $28,000, compared to just $12,000 in adjacent Federal Hill. Low-income Hispanic children in Elmhurst have a predicted household income of $69,000, whereas in Wanskuck the prediction for Hispanic children amounts to less than a third of this at $22,000.
Nationally and locally, no single explanation exists for divisions between neighborhoods. While some suggest that schools are determining factors, Hoyle stressed that they “don’t explain everything.” He noted that Providence has a school choice system which means neighborhoods do not necessarily directly correspond with specific schools.
Logan hypothesized that neighborhood disparities are influenced by “our usual measures of advantage and resources, which are the quality of the elementary school the children who live there go to, the crime rate in the very local neighborhood, the poverty rate, the percent of residents who have a college degree or a high school degree, the racial composition, the percent who are immigrants (and) the percent who speak English well,” he said.
The interests of those who control public policy could complicate attempts to unite behind the new data for progressive change, Logan explained. “Those who are advantaged in the current system have no incentive to change it, and those who are disadvantaged have no influence over policy. So there’s a lot of talk about it, but not very much action,” he said.
“You may change the neighborhood and get rid of some poor people and replace them with more affluent people, but it’s not exactly attacking poverty,” he added.
Hoyle said academics and municipal leaders have expressed interest in the study and its implications for concrete policy action.
“Mayors throughout the country will tell you that there is a growing concern about income and wealth inequality in cities throughout America, but for too long we have been lacking the tools to meaningfully measure how our cities fare in terms of mobility,” wrote Deputy Director of Communications for Mayor Jorge Elorza Ben Smith in an email to The Herald. He added that the new available data will help inform Elorza’s team when making decisions regarding “deeper investments in initiatives that promote social and economic mobility here in Providence.”
The responsibility for disparities belongs to “all levels of government,” Logan said. He cited housing vouchers, an increase in construction of affordable housing, combating discrimination in housing and investment in schools as starting points for improving poor neighborhoods. Moving people to better neighborhoods should supplement these strategies, he added.
This study “increases the pressure; the more visibility it gets, the better,” Logan said. “I’m so glad they did this study; I’m so glad it got reported in the New York Times. There should be more.”