Fall 2019 poll results can be found here.
1. Do you approve or disapprove of the way Christina Paxson is handling her job as the president of the University?
8.1% Strongly approve
27.3% Somewhat approve
17.7% Somewhat disapprove
5.3% Strongly disapprove
41.7% No opinion
2. Do you approve or disapprove of the way the Undergraduate Council of Students is handling its job?
7.6% Strongly approve
31.2% Somewhat approve
6.7% Somewhat disapprove
1.3% Strongly disapprove
53.3% No opinion
Questions 1 and 2 appear on The Herald’s poll every semester.
3. How satisfied are you with the available meal plan options?
5.8% Very satisfied
26% Somewhat satisfied
33.6% Somewhat dissatisfied
29.3% Very dissatisfied
1.7% Unsure
3.6% No opinion
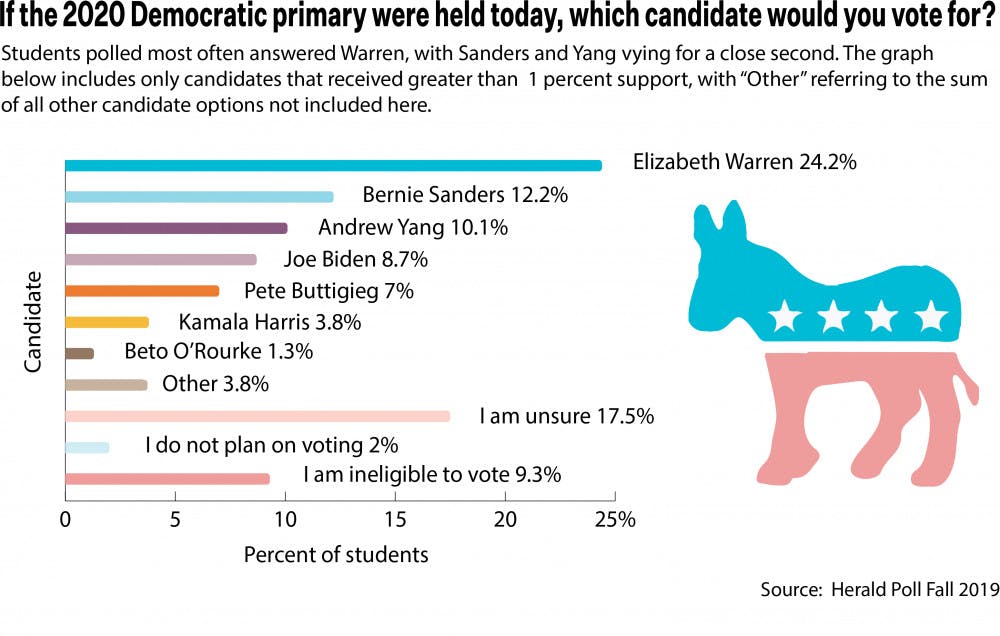
4. If the 2020 Democratic primary were held today, which candidate would you vote for?
8.7% Joe Biden
0.8% Cory Booker
0% Steve Bullock
7% Pete Buttigieg
0.5% Julián Castro
0% John Delaney
0.6% Tulsi Gabbard
3.8% Kamala Harris
0.3% Amy Klobuchar
0.1% Wayne Messam
1.3% Beto O’Rourke
0.1% Tim Ryan
12.2% Bernie Sanders
0% Joe Sestak
0% Tom Steyer
24.2% Elizabeth Warren
0% Marianne Williamson
10.1% Andrew Yang
1.5% Other
17.5% I am unsure
2% I do not plan on voting
9.3% I am ineligible to vote
Question 4 was adapted from the wording of a collection of national polls on candidate support in the Democratic primary. The list of candidates included as options in this question was based on a Sept. 25 Quinnipiac poll. The final four non-candidate options in this question were based on the responses from past Herald poll questions on candidate support, including the Fall 2015 Herald Poll.
5. Taking all things together, how happy would you say you are?
33.9% Very happy
53.7% Somewhat happy
8.2% Not very happy
1.1% Not at all happy
3.2% Don’t know
Question 5 was adapted from the wording of the World Values Survey. The second option was changed from “Rather happy” to “Somewhat happy” to more closely match the wording of responses to other questions in The Herald poll.
6. What do you think is the most important issue facing this country today?
15.9% Current government leadership
37.8% Environment/Climate change
10.9% Gap between rich and poor
10.1% Gun control
6.9% Healthcare
3.5% Immigration
1.9% National debt
4% Poverty/Homelessness
5.2% Race relations/Racism
0.6% Unemployment
3.3% Other
Question 6 uses the wording of Gallup’s “Most Important Problem” poll question, which is an open-ended question that classifies responses into several categories. The responses in The Herald’s version of this poll question were based on some of the most common categories of responses to the Gallup poll question.
7. How safe do you feel outside on campus after dark?
32.9% Very safe
47.9% Somewhat safe
16% Somewhat unsafe
2.5% Very unsafe
0.4% Unsure
0.3% No opinion
8. How safe do you feel outside in areas surrounding campus after dark? (incl. Thayer Street)
14.8% Very safe
43.7% Somewhat safe
33.9% Somewhat unsafe
5.9% Very unsafe
1.3% Unsure
0.4% No opinion
9. How satisfied are you with your current housing situation?
42.2% Very satisfied
41.8% Somewhat satisfied
11.4% Somewhat unsatisfied
3.9% Very unsatisfied
0.2% Unsure
0.4% No opinion
10. How often do you use an E-cigarette (e.g. JUUL)?
4.2% Daily
3% Two to three times a week
2.9% Once a week
8.1% Once or twice a month
81.9% Never
Question 10 was repeated from the Fall 2018 poll. This follows recent coverage in The Herald on a community health advisory issued by Health Services on the risks of e-cigarette use.
11. What type of romantic or sexual relationship are you in right now?
25.6% Exclusive relationship with one other person
0.5% Exclusive relationship with multiple people
5.6% Consistent hook-ups with one other person
1.3% Consistent hook-ups with multiple people
8.9% Casual hook-ups with multiple people
1.5% Other
54.6% Not in any kind of relationship
2% Do not know
12. What type of romantic or sexual relationship do you want right now?
56.1% Exclusive relationship with one other person
1.4% Exclusive relationship with multiple people
8.3% Consistent hook-ups with one other person
2.3% Consistent hook-ups with multiple people
4% Casual hook-ups with multiple people
1.1% Other
12.2% Not in any kind of relationship
14.6% Do not know
Questions 11 and 12 were repeated from the Fall 2012 Student Poll.
The poll was conducted over the course of two days from Oct. 2 – 3. The margin of error is 3.1 percent with 95 percent confidence. The margins of error for specific subsets are as follows: 3.8 percent for females, 4.6 percent for males, 5 percent for first-years, 5 percent for sophomores, 5.4 percent for juniors, 5.6 percent for seniors, 4.5 percent for students who receive financial aid and 3.9 percent for students who do not receive financial aid.
The sample of undergraduate students who took the poll is demographically similar to the student body. The sample was 40.7 percent male and 58.6 percent female. First-years made up 31.9 percent, sophomores 30.3 percent, juniors 22.1 percent and seniors 15.7 percent of the poll. Of the students polled, 33.7 percent receive grants from the University covering some costs, 9.8 percent receive grants covering all costs and 56.5 percent receive no financial aid. Varsity athletes made up 8.4 percent, while non-athletes made up 91.6 percent of the sample. Of students surveyed, 77.2 percent identify as heterosexual, 5.9 percent as gay, 13.7 percent as bisexual and 3.2 percent as other. Those involved in a Greek life organization made up 11 percent of all surveyed.
In the sample, 50.7 percent identify as white, 38.2 percent as Asian, 9.7 percent as Hispanic, 9.8 percent as black, 0.9 percent as American Indian/Alaska Native, 0.5 percent as Native Hawaiian/Pacific Islander and 3.7 percent as other. The percentages add up to more than 100 percent because some students selected more than one race/ethnicity. Students surveyed also marked their concentration area(s): 31.3 percent are in the humanities/arts, 22.3 percent in life sciences, 38.8 percent in physical sciences, 14.6 percent in business (BEO or economics) and 21.6 percent in social sciences (not including BEO or economics). Of the students polled, 16 percent are legacy students, meaning they have a parent, grandparent or sibling who attended Brown, while 84 percent are not. First-generation students made up 16.1 percent of students who took the poll, and non-first-generation students made up 83.9 percent of the sample. Statistical significance was established at the 0.05 level. All cross tabulations are statistically significant.
University News Editor Jacob Lockwood ’21 and Science and Research Editor Cate Ryan ’21 coordinated the poll. The poll was conducted on campus by Herald section editors, senior staff writers and other staff members.
Over the next few weeks, The Herald will release a series of articles about individual poll questions.