Spring 2018 poll results can be found here.
Do you approve or disapprove of the way Christina Paxson is handling her job as president of the University?
19.8% Strongly approve
39.6% Somewhat approve
6.0% Somewhat disapprove
0.2% Strongly Disapprove
34.4% No opinion
Do you approve or disapprove of the way the Undergraduate Council of Students is handling its job representing and addressing the concerns of the undergraduate student body?
10.2% Strongly approve
25.1% Somewhat approve
3.7% Somewhat disapprove
0.9% Strongly disapprove
60.2% No opinion
How strongly do you agree with the following: I feel like my concentration is respected by the Brown community.
54.8% Strongly agree
35.2% Somewhat agree
8.4% Somewhat disagree
1.5% Strongly disagree
Which of the following are you planning to apply to or attend?
13.4% Law school
27.1% Medical school
0.7% Veterinarian school
13.4% Business school
29.7% Academic PhD or Masters program
3.9% Other
12.1% None, I am not on a pre-professional track
How strongly do you agree with the following: I am confident in how my body looks.
24.8% Strongly agree
51.9% Somewhat agree
17.8% Somewhat disagree
5.6% Strongly disagree
How often do you take food from Brown eateries without paying (Josiah’s, Andrews, Blue Room, Campus Market, Ivy Room, library cafes)?
6.0% Daily
6.8% Two to three times a week
6.6% Once a week
14.9% Once or Twice a month
65.7% Never
How comfortable would you be approaching the Title IX office in response to an incident of sexual assault/violence/harassment?
23.2% Very comfortable
39.7% Somewhat comfortable
18.3% Somewhat uncomfortable
1.8% Very uncomfortable
17.0% No opinion
Have you ever felt you’ve had an inappropriate or uncomfortable sexual or romantic encounter with your professor or teaching assistant?
3.1% Yes
96.9% No
How often do you call a member of your family?
22.2% At least once per day
59.5% At least once per week
15.0% At least once per month
2.6% Less than once per month
0.6% Less than once per semester
For which, if any, of the following conditions have you been prescribed medication in the past five years? (Circle all that apply)
16.6% Anxiety
3.0% Attention deficit disorder
2.4% Attention deficit hyperactivity disorder
1.1% Bipolar disorder
13.3% Depression
2.7% Obsessive-Compulsive disorder
0.1% Schizophrenia
2.8% Another mental health condition
76.7% None of the above
The poll was conducted over the course of three days — March 14-16. The margin of error is 3.4 percent with 95 percent confidence. The margins of error for specific subsets are as follows: 4.0 percent for females, 4.7 percent for males, 5.0 percent for first-years, 5.6 percent for sophomores, 6.9 percent for juniors, 7.1 percent for seniors, 4.5 percent for students who receive financial aid and 4.1 percent for students who do not receive financial aid.
The sample of students who took the poll is demographically similar to the undergraduate student body. The sample was 41.6 percent male and 56.8 percent female. First-years made up 33.6 percent, sophomores 28.3 percent, juniors 19.4 percent and seniors 18.7 percent of the poll. Of students represented in the poll, 5 percent receive just loans, 17.8 percent receive grants and loans, 15.8 percent receive grants covering some costs, 6.5 percent receive grants covering all costs and 54.9 percent receive no financial aid. Varsity athletes made up 9.9 percent, while non-athletes made up 90.1 percent of the sample. Of students surveyed, 79.4 percent identify as heterosexual, 4.5 percent as gay, 11 percent as bisexual and 5.1 percent as other. Those involved in a greek life organization made up 15.9 percent, while non-greek affiliated made up 84.1 percent.
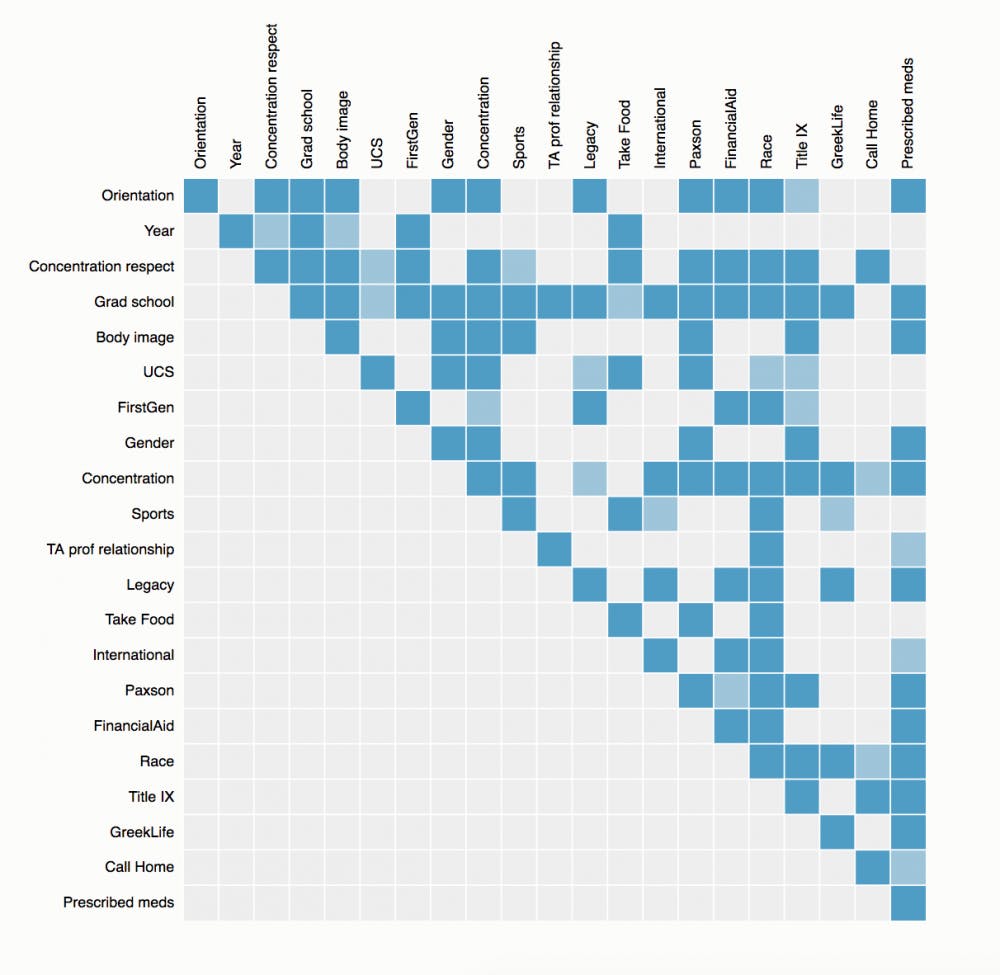
Of students surveyed, 57.2 percent identify as white, 32.5 percent as Asian, 10.9 percent as Hispanic, 7.2 percent as black, 2 percent as American Indian/Alaska Native, 0.8 percent as Native Hawaiian/Pacific Islander and 2.9 percent as other. Students also marked their concentration area(s) — 31.7 percent are in the humanities/arts, 23.2 percent in life sciences, 32.2 percent in physical sciences, 12.5 percent in business (BEO or econ) and 20.2 percent in social sciences. Of students polled, 13.5 percent are legacy students, meaning they have a parent, grandparent or sibling who attended Brown, and 86.4 percent are not. First-generation students made up 16.4 percent of students surveyed and non-first-generation students made up 83.6 percent of the sample. Statistical significance was established at the 0.05 level. All cross tabulations are statistically significant.
University News Editor Anna Kramer ’20 and Metro Editor Emily Davies ’19.5 coordinated the poll. Herald section editors, senior staff writers and other staff members conducted the poll.
Over the next several weeks, The Herald will publish a series of articles about individual poll questions. Find results of previous polls at thebdh.org/poll.