Click here to view correlations between questions.
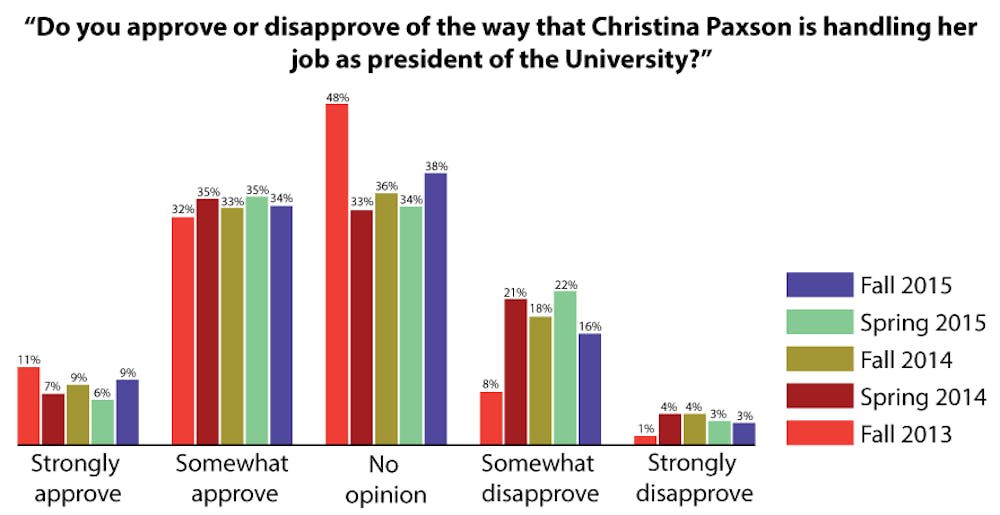
1. Do you approve or disapprove of the way Christina Paxson is handling her job as president of the University?
9.2% Strongly approve
33.7% Somewhat approve
38.3% No opinion
15.7% Somewhat disapprove
3.1% Strongly disapprove
2. How many times have you met with your academic advisor this year (spring and fall 2015)?
16.8% 0
60.5% 1-2
17.6% 3-4
5.1% 5 or more
3. How often do you smoke cigarettes or e-cigarettes?
82.6% I do not smoke cigarettes or e-cigarettes
9.7% Rarely
3.7% Several times per month
2.1% Several times per week
1.9% At least daily

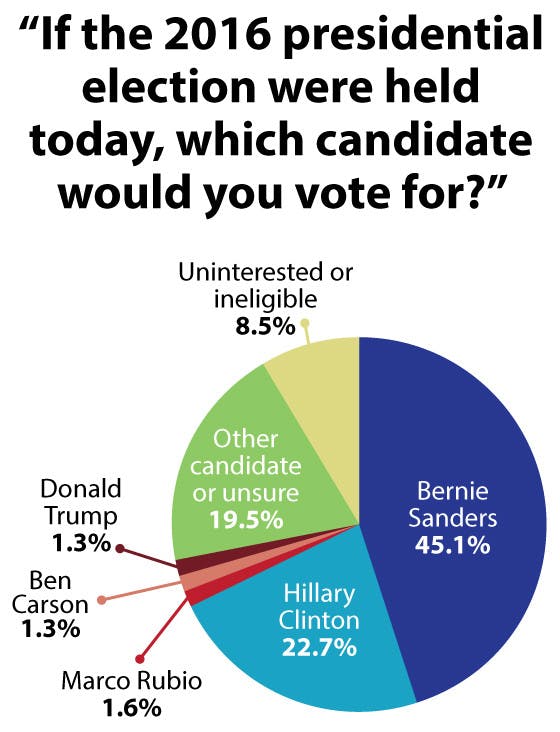
4. If the 2016 presidential election were held today, which candidate would you vote for? (Please select only one.)
1.1% Jeb Bush
1.3% Ben Carson
0.7% Chris Christie
22.7% Hillary Clinton
0.1% Ted Cruz
0.3% Carly Fiorina
0% Mike Huckabee
0% Bobby Jindal
0% John Kasich
0.8% Martin O’Malley
0.4% Rand Paul
1.6% Marco Rubio
45.1% Bernie Sanders
0% Rick Santorum
1.3% Donald Trump
0.7% Other
15.4% I am unsure
8.5% I am uninterested in voting or ineligible to vote
5. How many Counseling and Psychological Services appointments have you had in your time at Brown?
73.5% 0
8.7% 1
10.6% 2-4
2.5% 5-6
1.3% 7
3.3% 7, and I received outside help after a CAPS referral
6. How many hours per week do you exercise?
14.7% 0
39.5% 1-3
28.1% 4-7
7.2% 8-10
3.0% 11-13
7.5% 14 or more
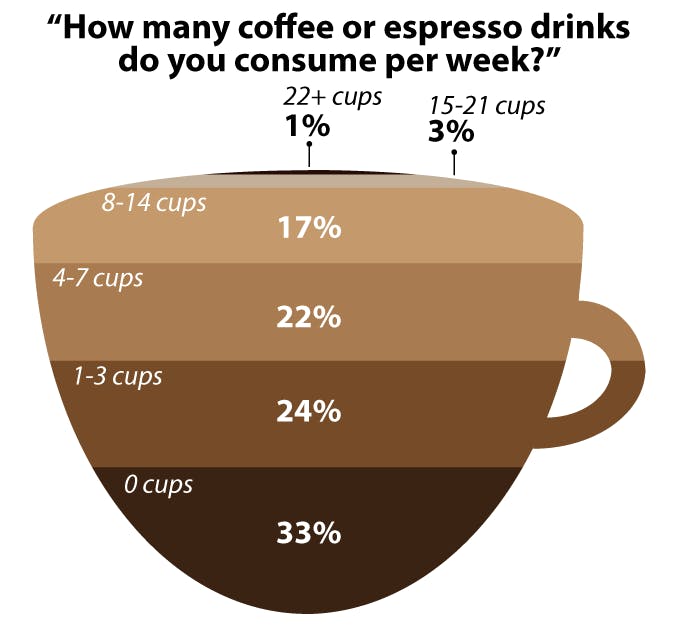
7. How many coffee or espresso drinks do you consume per week?
33.0% 0
24.1% 1-3
21.5% 4-7
16.9% 8-14
3.2% 15-21
1.3% 22 or more
8. Have you felt shamed for your sexual activity or choices by University staff members, faculty members or administrators?
4.8% Yes
95.2% No
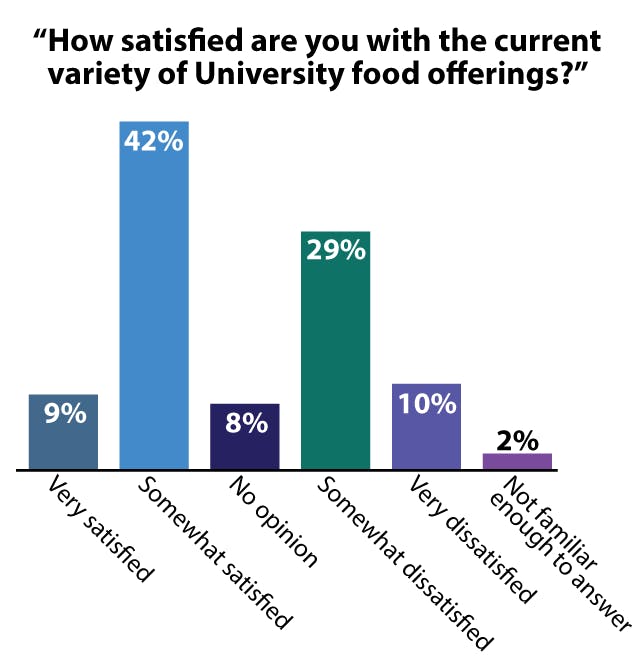
9. How satisfied are you with the current variety of University food offerings?
9.1% Very satisfied
41.9% Somewhat satisfied
8% No opinion
28.7% Somewhat dissatisfied
10.4% Very dissatisfied
2% Not familiar enough to answer
10. How satisfied are you with Brown’s law and medical school advising?
3.1% Very satisfied
9.3% Somewhat satisfied
35.4% No opinion
8.1% Somewhat dissatisfied
4.5% Very dissatisfied
39.6% I am not considering applying to law or medical school
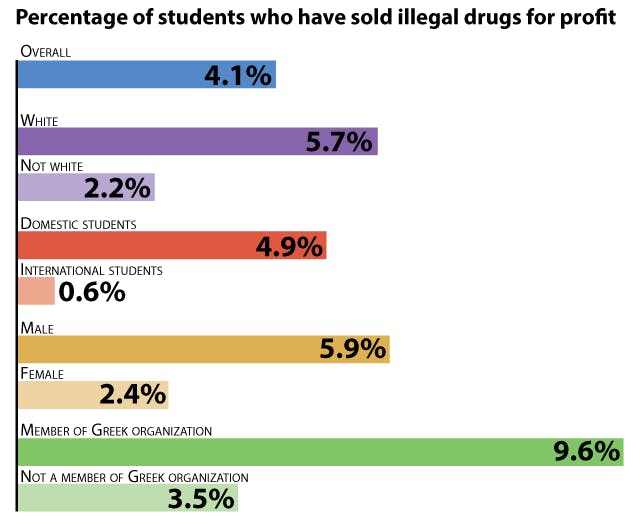
11. Have you ever sold illegal drugs for profit?
4.1% Yes
95.9% No
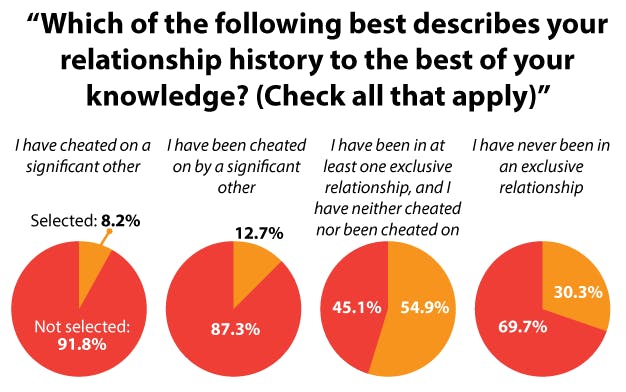
12. Which of the following describes your relationship history to the best of your knowledge? (Check all that apply.)
8.2% I have cheated on a significant other
12.7% I have been cheated on by a significant other
54.9% I have been in at least one exclusive relationship, and I have neither cheated nor been cheated on
30.3% I have never been in an exclusive relationship
13. Which of the following best describes your history of substance use during class? (Check all that apply.)
7.6% I have been drunk during class
9.1% I have been under the influence of marijuana during class
3.8% I have been under the influence of another controlled substance during class
85.5% I have never been intoxicated during class
Methodology
The data reported come from 913 written questionnaires administered to undergraduates Oct. 28-29 in the lobby of J. Walter Wilson, the Stephen Robert ’62 Campus Center and the Sciences Library. The poll has a 3 percent margin of error with 95 percent confidence. The margin of error is 4.63 percent for the subset of males, 3.99 percent for females, 5.38 percent for first-years, 5.56 percent for sophomores, 6.81 percent for juniors, 6.74 percent for seniors, 4.16 percent for students receiving financial aid and 4.41 percent for students not receiving financial aid.
The sample polled was demographically similar to the Brown undergraduate population as a whole. The sample was 43.0 percent male and 56.3 percent female. First-years made up 30.5 percent of the sample, 28.8 percent were sophomores, 20.0 percent were juniors and 20.7 percent were seniors. Varsity athletes made up 10.4 percent of the sample. Students involved in Greek life made up 10.6 percent of the sample. Of those polled, 52.0 percent currently receive financial aid through Brown. Students reported all races with which they identify, with 54.6 percent saying white, 29.8 percent Asian, 12.8 percent Hispanic, 9.9 percent black, 1.3 percent American Indian or Alaska Native, 1.1 percent Native Hawaiian or Pacific Islander and 3.6 percent other.
Statistical significance was established at the 0.05 level. All reported cross-tabulations are statistically significant.
University News Editor Emma Harris ’17, Sports Editor Andrew Flax ’17, Social Media Editor Camilla Brandfield-Harvey ’15.5 and Senior Staff Writers Lauren Aratani ’18, Matt Brownsword ’18 and Taneil Ruffin ’17 coordinated the poll. Herald section editors, senior staff writers and other staff members conducted the poll.
Over the next several weeks, The Herald will publish a series of articles about individual poll questions. Find results of previous polls at thebdh.org/poll.
Correction: Due to a data processing error, a previous version of this article misreported some data from The Herald's October 2015 poll. No individual percentages were off by more than 0.5 percentage points. Additionally, a graphic entitled, "Which of the following describes your relationship history to the best of your knowledge? (Check all that apply)" used incorrect data and was mislabeled. The Herald regrets the errors.