Fall 2018 poll results can be found here.
Do you approve or disapprove of the way Christina Paxson is handling her job as the president of the University?
15.2% Strongly approve
37.8% Somewhat approve
7.5% Somewhat disapprove
1.6% Strongly disapprove
37.8% No opinion
Do you approve or disapprove of the way the Undergraduate Council of Students is handling its job?
8.8% Strongly approve
33.8% Somewhat approve
7.5% Somewhat disapprove
1% Strongly disapprove
48.9% No opinion
Should Brown consider race when hiring professors?
59.0% Yes
8.6 % No, but it should consider other aspects of diversity, like gender
21.1% No
11.3% No opinion
Should Brown consider race in student admissions decisions?
64.7% Yes
8% No, but it should consider other aspects of diversity, like gender
19.1% No
8.3% No opinion
Have you taken at least one Diversity and Inclusion Action Plan-designated course?
21.9% Yes
44.7% No
19.1% Not sure
14.3% I do not know what that designation is
How often do you use an E-cigarette (e.g. JUUL)?
4.9% Daily
2.5% Once a week
4.1% Two to three times a week
8.7% Once or twice a month
79.7% Never
Are you registered to vote?
9.7% Yes, in Rhode Island
64% Yes, but not in Rhode Island
10.4% No
1.2% I do not know
14.7% I am not eligible to vote in the United States
Did you vote in the midterm elections?
56.2% Yes
29.4% No
14.4% I am not eligible to vote in the United States
What are your primary motivations in considering your first job after graduation? (Select your top two.)
40.4% Salary
13.5% Prestige
43.1% Societal impact
26.2% Work-Life balance
19% Location
35.1% Excitement
4.8% Other
Do you support admission processes that give an advantage to potential varsity athletes?
23% Yes
55.5% No
21.5% No opinion
How important do you think athletics is to the Brown community?
7.7% Very important
26.8% Somewhat important
22.7% Neutral
28.9% Somewhat unimportant
13.9% Very unimportant
How important do you think athletics should be to the Brown community?
9.6% Very important
31.7% Somewhat important
30.1% Neutral
18.1% Somewhat unimportant
10.6% Very unimportant
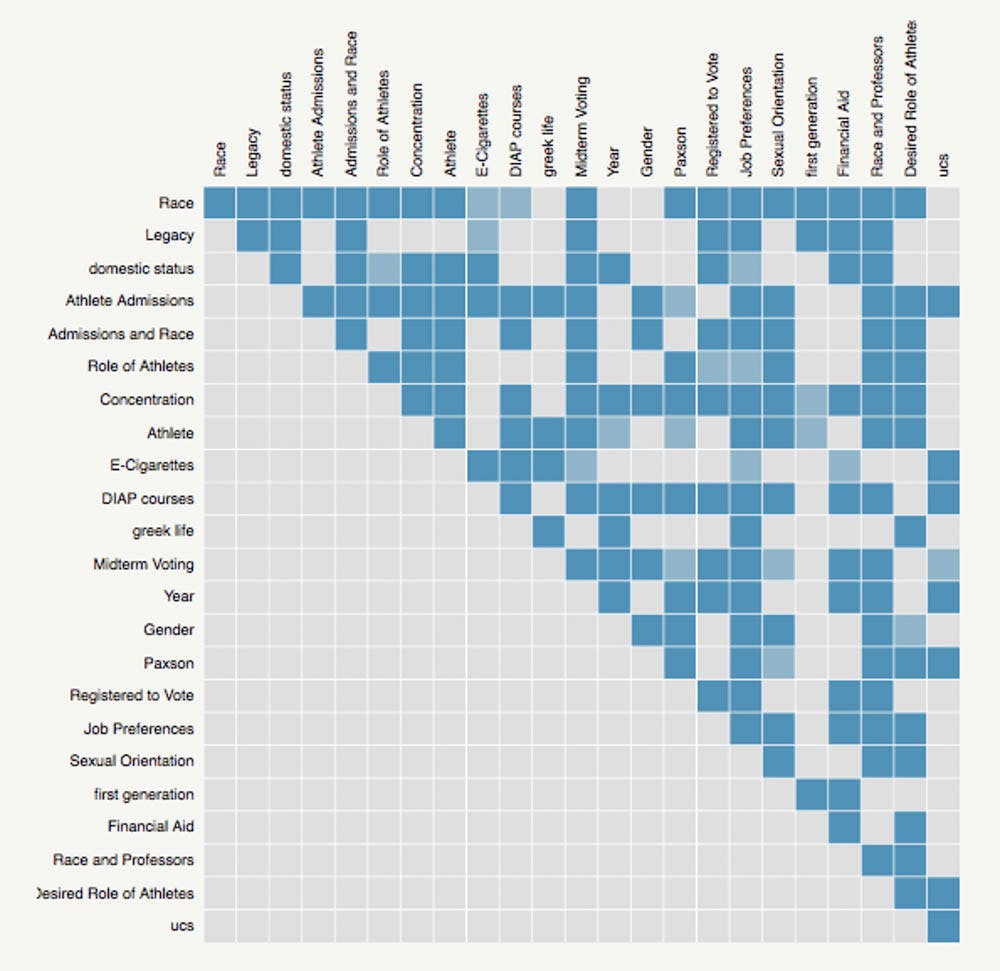
The poll was conducted over the course of three days — Nov. 7-9. The margin of error is 3.1 percent with 95 percent confidence. The margins of error for specific subsets are as follows: 3.8 percent for females, 4.3 percent for males, 4.5 percent for first-years, 4.7 percent for sophomores, 5.1 percent for juniors, 5.6 percent for seniors, 4.4 percent for students who receive financial aid and 3.8 percent for students who do not receive financial aid.
The sample of students who took the poll is demographically similar to the undergraduate student body. The sample was 42.1 percent male and 56.4 percent female. First-years made up 29.7 percent, sophomores 27.5 percent, juniors 23.8 percent and seniors 19 percent of the poll. Of students represented in the poll, 32.9 percent receive grants covering some costs, 9.8 percent receive grants covering all costs and 57.4 percent receive no financial aid. Varsity athletes made up 11.5 percent, while non-athletes made up 88.5 percent of the sample. Of students surveyed, 79 percent identify as heterosexual, 5.4 percent as gay, 11.2 percent as bisexual and 4.3 percent as other. Those involved in a greek life organization made up 10.9 percent, while non-greek affiliated made up 89.1 percent.
Of students surveyed, 54.5 percent identify as white, 35.7 percent as Asian, 10.6 percent as Hispanic, 9.1 percent as black, 0.7 percent as American Indian/Alaska Native, 1.1 percent as Native Hawaiian/Pacific Islander and 3 percent as other. (Note that percentages add up to more than 100 percent since some students selected more than one race/ethnicity.) Students also marked their concentration area(s) — 31.4 percent are in the humanities/arts, 22.9 percent in life sciences, 35.2 percent in physical sciences, 15.8 percent in business (BEO or economics) and 21.7 percent in social sciences. Of students polled, 14.5 percent are legacy students, meaning they have a parent, grandparent or sibling who attended Brown, and 85.5 percent are not. First-generation students made up 15.3 percent of students surveyed and non-first-generation students made up 84.7 percent of the sample. Statistical significance was established at the 0.05 level. All cross tabulations are statistically significant.
Science and Research Editor Jonathan Douglas ’20 and Metro Editor Emily Davies ’19.5 coordinated the poll. Herald section editors, senior staff writers and other staff members conducted the poll.
Over the next several weeks, The Herald will publish a series of articles about individual poll questions.