Picture thousands of undergraduate students unpacking their bags at an isolated Brown University campus free from outside contact amid the COVID-19 pandemic. In this simplified scenario, a certain number of these students are carrying stowaway SARS-CoV-2 particles. Others have yet to be exposed to the virus and have not developed immune protection against it.
Assume that each student breaks the six-foot barrier between them and others at a specified interval as they go about their days, that they continue to pass on the virus for a period of time and that each person’s recovery spans a set period, after which they cannot get COVID-19 again.
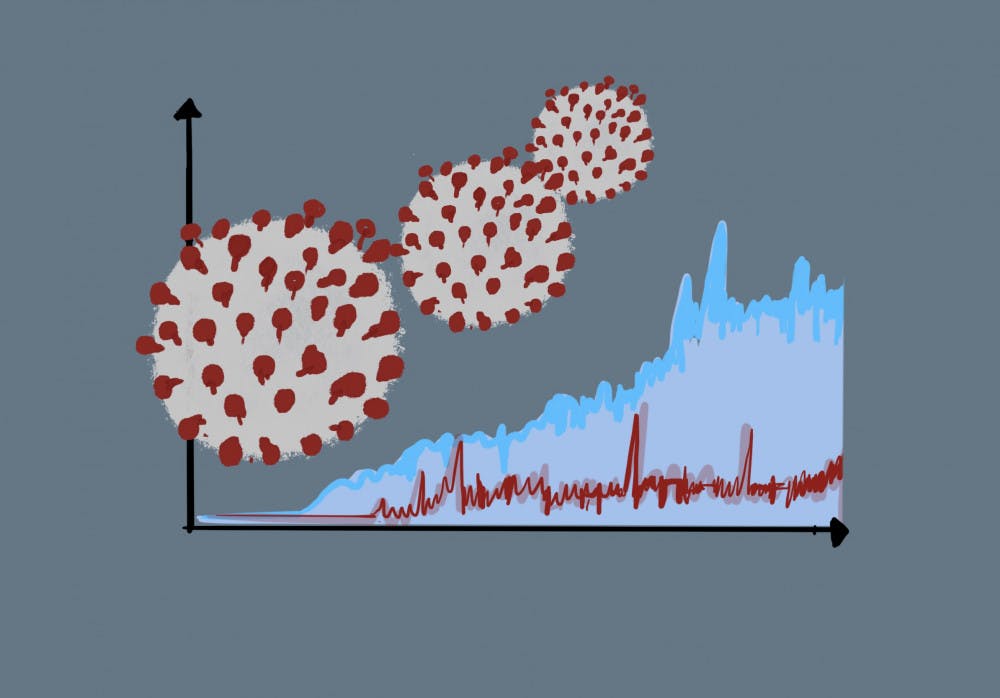
By assigning each of these variables a predicted value, researchers can incorporate them into a model to estimate the rise and fall of COVID-19 — the familiar “curve” — for this hypothetical Brown University.
While this situation is not exactly representative of the epidemiological models that have informed the University’s decisions, the more complex models used were similarly grounded in rudimentary scenarios.
According to Brown’s Plan for a Healthy and Safe 2020-21, released July 7, these models estimated that the campus could see at most five newly infected students and 50 symptomatic tests per day and allotted a 180-person capacity for isolation and quarantine dorms given the predicted number of cases and contacts from all students opting to study on-campus.
But “you can’t treat the model like a crystal ball. The model doesn’t actually know the future — it just knows what’s likely to happen based on the assumptions that you’re making today,” said Associate Professor of Emergency Medicine Adam Levine, who has been involved in building epidemiological models for the University’s Healthy Fall 2020 Task Force this summer. “You’d want to see models used to change people’s behavior.”
“You can’t treat the model like a crystal ball.”
At the University, the model has served as a “a tool to help us figure out … the tremendous amount of logistics that the University’s putting into making Brown safe for the fall,” such as necessary “public health measures” to manage infection numbers, Levine said.
The value of models
Statistical data on COVID-19 are “lagging indicators,” said Kevin Wilson, head of data science at Brown’s Policy Lab. By the time researchers get their hands on the number of positive tests, for example, they are telling researchers about infections that happened sometime in the past, Wilson added. Since a model can help approximate the situation at a time point after the data was retrieved, it “at least gets us a little closer to a leading indicator.”
The Brown Policy Lab creates models, but also functions as an intermediary connecting R.I. policymakers to researchers. The Office of the Governor and the Rhode Island Department of Health have gathered the data put into the Rhode Island models; the predictions shared with these offices inform public health decisions, such as the transition between COVID-19 phases, said Professor of Health Services, Policy and Practice and Director of the Center for Evidence Synthesis in Health Tom Trikalinos, who has been programming these models.
While this model is always accessible to policymakers, it is only “one piece of information among many that goes into those decisions,” Wilson said. The model’s purpose is “to be a warning more than anything.”
Government and public health officials plan how to avoid the worst possible modeled situation and decide on future steps given predictions from current data, Trikalinos said.
The models help foresee possibilities roughly 15 to 30 days into the future, thereby assisting with plans for resource demand, such as the number of hospital beds or COVID-19 tests, Wilson added.
But when a dramatic shift occurs in the community, such as reopening schools in Rhode Island, the models cannot produce accurate estimates since there is no data accounting for how that situation will affect the spread of COVID-19, said John Fulton ‘71 MA’74 MA’75 PhD’78, clinical associate professor of behavioral and social sciences and former associate director at the Rhode Island Department of Health, who is working on state models with Trikalinos. Once such a shift occurs, researchers must gather data once again to make informed predictions.
But many epidemiological models originate from frameworks called Susceptible, Infected and Recovered (SIR) models, according to Levine. Levine noted the principle variables in these foundational equations: the number of people susceptible to the epidemic under investigation, the number infected, the number recovered, the duration of infectiousness and recovery, the frequency of contact between the susceptible and the infected and how quickly people transition from susceptible to infected and then to recovered status, in cases where patients have not died from the illness. This model then predicts how fast the virus will spread, Levine said.
Taking in this information, the SIR calculates and visually displays the expected outcome for this situation — provided the conditions of the initial setup stay constant.
“Developing those numbers, that is sort of where the art is to this process.”
Professor of Economics and Professor of International and Public Affairs Emily Oster, who helped relay data from Rhode Island’s COVID-19 models to the community earlier this year, said that “the predictions of the models are very sensitive” to input parameters, so even slight changes in the numbers can lead to day-to-day fluctuations that people may have noticed on public COVID-19 dashboards.
The SIR model could forecast the future well to people marooned on an island, Levine said, but not so much to dynamic communities.
Refining models
In the case of the University, how do these models consider people who wear personal protective equipment? What about those who come into contact with people outside of the University? To address these circumstances, researchers embellish basic models by including data on additional factors that can sway the scales, Levine said.
More involved SIR models cater well to Rhode Island because of the state’s detailed data collection. Rhode Island researchers have used their data sets showing previous trends to build SIR models that “can produce results very quickly” to draw rapid predictions about the effects of a potential change in circumstances, Fulton said.
Trikalinos relies on more complex statistics to generate a “much more sophisticated model and refined estimates” than the SIR model for Rhode Island that considers a range of possible input values for conditions under consideration, as opposed to using concrete numbers, Fulton said. These models can automatically adjust to changes in the input data, such as an increase in positive COVID-19 cases, without the hassle of altering the model’s underlying code. They can also make predictions for specific geographic locations.
The trade-off is waiting longer for the programming to adapt to these changes and compute the result, Fulton said.
But SIR models’ comparative simplicity does not make them expendable. “Whenever we do a modeling exercise, we want to have the straightforward thing because if the complex doesn’t agree, there’s something bad in the complex” model, Trikalinos said.
As for deciding on the exact rates to input into these projects, “developing those numbers, that is sort of where the art is to this process,” Levine said. It’s also “the hard part:” More numbers means the models’ complexity and accuracy in matching the real-life circumstances increases.
“The art is in selecting categories that are simple (and) … at the same time capture salient aspects,” Trikalinos said.
This process warrants analysis of data on the virus, especially in the context of the community under representation. When attempting to model the University, relevant Rhode Island rates may be considered, Levine said. He added that unequal access to public health or health care would influence the modeled outcome differently across city and state borders.
But more variables also toss in more assumptions — assumptions about the efficacy of personal protective equipment, the public’s responsiveness to guidelines and whether the generation of antibodies would actually prevent the recurrence of the disease in a person.
Studies on the body’s speed in turning over antibody molecules to respond to and protect against COVID-19, as well as statistics on average transmission rates and population density, help guide some estimates, yet others linger. “The hardest part about developing these models is making assumptions ... about how well everyone is going to follow (the rules),” Levine said.
“It is very reasonable ... not to have a single one but to have a collection of models that make different assumptions about the structure of reality that we assume.”
A challenge felt by most task forces developing COVID-19-related models is accounting for the asymptomatic patients, who comprise an undefined portion of the population and whose likelihood of COVID-19 transmission are summed up with “poor numbers,” Levine said, noting that asymptomatic transmission rates are “probably the biggest difference you see between different models.” This lack of accurate data has limited the models’ efficacy.
“No one knows what is the optimal way to model a phenomenon like this,” Trikalinos said. So “it is very reasonable ... not to have a single one but to have a collection of models that make different assumptions about the structure of reality that we assume.”
The goal of epidemiological modeling is not to let a disease like COVID-19 run its course so that it follows the exact blueprint the model has drawn; everyone should not contract a virus to resolve a pandemic and flatten the curve.
Oster noted that if the severity of the pandemic does not reach the calculated peak, as was the case in Rhode Island, this inaccuracy is not necessarily a flaw in the model but rather indicates that the state took active steps to deter that outcome.
Trikalinos noted this “reflexivity” inherent to his and his colleagues’ pandemic models: “When we model the evolution of the epidemic, the predictions that the models give may spur some government response, and this may change the evolution of the system.”