Spring 2019 poll results can be found here.
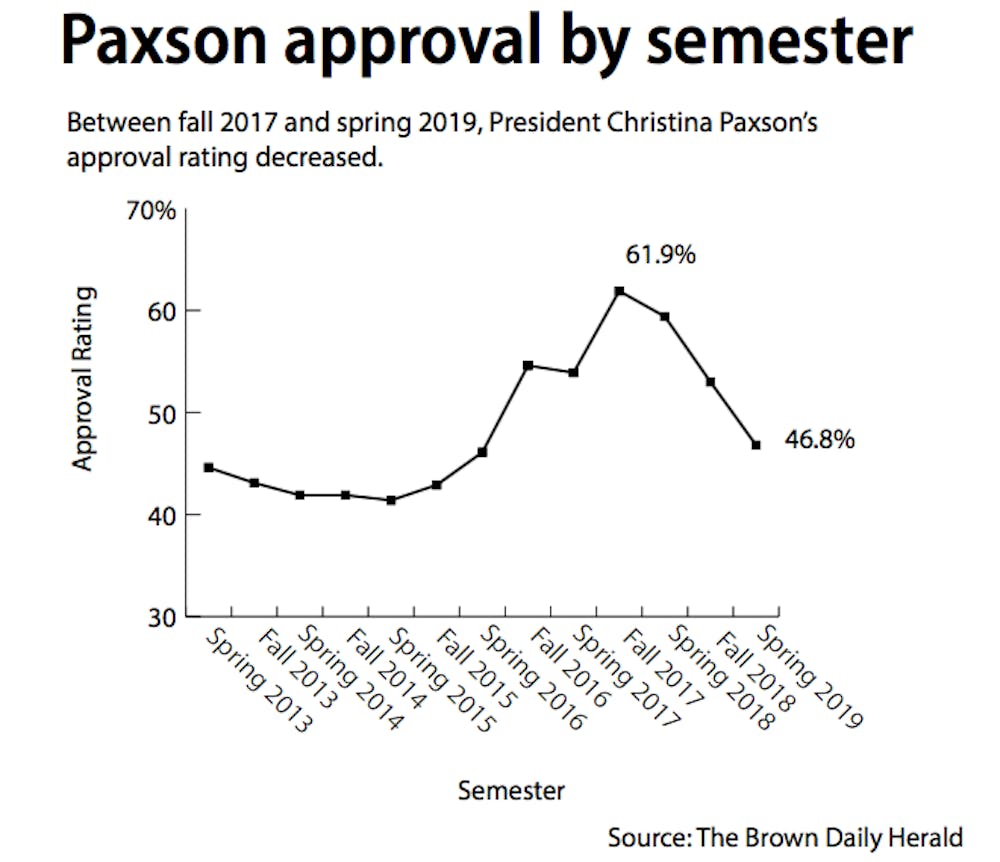
1. Do you approve or disapprove of the way Christina Paxson is handling her job as the president of the University?
7.7% Strongly approve
39.1% Somewhat approve
21.6% Somewhat disapprove
3.4% Strongly disapprove
28.2% No opinion
2. Do you approve or disapprove of the way the Undergraduate Council of Students is handling its job?
8.3% Strongly approve
32.4% Somewhat approve
7.4% Somewhat disapprove
2.1% Strongly disapprove
49.9% No opinion
3. Should Brown consider legacy status in student admission? (i.e. having a parent, grandparent or sibling who attended Brown)
29.6% Yes
51.5% No
19% No opinion
4. How likely are you to live or work in Rhode Island after completing all of your higher education?
1.5% Very likely
14.4% Somewhat likely
31% Somewhat unlikely
53% Very unlikely
5. How often do you interact one-on-one with professors?
8.6% Daily
29.5% A few times per week
33.3% A few times per month
24.9% A few times per semester
3.7% Never
6. How often do you go off College Hill and into other areas of Providence?
5% Daily
32.1% A few times per week
45.6% A few times per month
16.2% A few times per semester
1.1% Never
7. What do you do when you go off campus into the Providence community? (Circle all that apply)
1.6% I don’t go off campus
79.9% Eat at restaurants
55.4% Grocery shopping
42.7% Retail shopping
35.5% Volunteer work
7% Paid work
60.9% Entertainment
27.3% Sightseeing
13.5% Other
8. Do you believe that the anonymous Facebook page Dear Blueno is a positive or negative contribution to student life?
9.6% Very positive
34.1% Somewhat positive
21.2% Somewhat negative
10.3% Very negative
24.7% No opinion
9. How strongly do you agree with the following: Brown is committed to diversity and equity.
15.9% Strongly agree
53.4% Somewhat agree
20.6% Somewhat disagree
6.4% Strongly disagree
3.7% No opinion
10. How much influence do you think students’ voices and opinions have on administrative decisions at the University?
7.8% Significant influence
45.7% Some influence
35% Little influence
4.1% No influence
7.5% Not sure
11. On average, how many hours of sleep do you get each weeknight?
2% Fewer than 4 hours
22.6% Between 4 and 6 hours
65.6% Between 6 and 8 hours
9.2% More than 8 hours
0.6% Unsure
12. On average, how many hours per week have you worked for pay this semester?
45.9% 0 hours
17.3% 1 - 5 hours
15.5% 6 - 9 hours
11.8% 10 - 15 hours
3.6% 16 - 20 hours
5.8% More than 20 hours
The poll was conducted over the course of two days from March 13 - 14. The margin of error is 3.1 percent with 95 percent confidence. The margins of error for specific subsets are as follows: 4.1 percent for females, 4.5 percent for males, 5.2 percent for first-years, 5.5 percent for sophomores, 7.1 percent for juniors, 7.4 percent for seniors, 4.6 percent for students who receive financial aid and 3.9 percent for students who do not receive financial aid.
The sample of undergraduate students who took the poll is demographically similar to the student body. The sample was 44.9 percent male and 54.2 percent female. First-years made up 33.8 percent, sophomores 30.4 percent, juniors 18.6 percent and seniors 17.1 percent of the poll. Of the students polled, 32.7 percent receive grants from the University covering some costs, 9.7 percent receive grants covering all costs and 57.6 percent receive no financial aid. Varsity athletes made up 10.2 percent, while non-athletes made up 89.8 percent of the sample. Of students surveyed, 79.4 percent identify as heterosexual, 6.6 percent as gay, 11.7 percent as bisexual and 2.3 percent as other. Those involved in a Greek life organization made up 16.5 percent, while non-Greek affiliated students made up 83.5 percent of all surveyed.
In the sample, 53.4 percent identify as white, 36 percent as Asian, 10.2 percent as Hispanic, 9 percent as black, 0.4 percent as American Indian/Alaska Native, 0.6 percent as Native Hawaiian/Pacific Islander and 3 percent as other. The percentages add up to more than 100 percent since some students selected more than one race/ethnicity. Students surveyed also marked their concentration area(s): 30.3 percent are in the humanities/arts, 24.4 percent in life sciences, 34 percent in physical sciences, 17.1 percent in business (BEO or economics) and 22.9 percent in social sciences (not including BEO or economics). Of the students polled, 13.4 percent are legacy students, meaning they have a parent, grandparent or sibling who attended Brown, while 86.6 percent are not. First-generation students made up 16.6 percent of students who took the poll and non-first-generation students made up 83.4 percent of the sample. Statistical significance was established at the 0.05 level. All cross tabulations are statistically significant.
University News Editor Jacob Lockwood ’21 and Science and Research Editor Cate Ryan ’21 coordinated the poll. The poll was conducted on campus by Herald section editors, senior staff writers and other staff members.
Over the next few weeks, The Herald will release a series of articles about individual poll questions.